Search this keyword

Showing posts with label EOL. Show all posts

BioNames: yet another taxonomic database

Yet another taxonomic database, this time I can't blame anyone else because I'm the one building it (with some help, as I'll explain below).

BioNames was my entry in EOL's Computable Data Challenge (you can see the proposal here: http://dx.doi.org/10.6084/m9.figshare.92091). In that proposal I outlined my goal:
BioNames aims to create a biodiversity “dashboard” where at a glance we can see a summary of the taxonomic and phylogenetic information we have for a given taxon, and that information is seamlessly linked together in one place. It combines classifications from EOL with animal taxonomic names from ION, and bibliographic data from multiple sources including BHL, CrossRef, and Mendeley. The goal is to create a database where the user can drill down from a taxonomic name to see the original description, track the fate of that name through successive revisions, and see other related literature. Publications that are freely available will displayed in situ. If the taxon has been sequenced, the user can see one or more phylogenetic trees for those sequences, where each sequence is in turn linked to the publication that made those sequences available. For a biologist the site provides a quick answer to the basic question “what is this taxon?”, coupled with with graphical displays of the relevant bibliographic and genomic information.

The bulk of the funding from EOL is going into interface work by Ryan Schenk (@ryanschenk), author of synynyms among other cool things. EOL's Chief Scientist Cyndy Parr (@cydparr) is providing adult supervision ("Chief Scientist", why can't I have a title like that?).

Development of BioNames is taking place in the open as much as we can, so there are some places you can see things unfold:


I've lots of terrible code scattered around which I am in the process of organising into something usable, which I'll then post on GitHub. Working with Ryan is forcing me to be a lot more thoughtful about coding this project, which is a good thing. Currently I'm focussing on building an API that will support the kinds of things we want to do. I'm hoping to make this public shortly.

The original proposal was a tad ambitious (no, really). Most of what I hope to do exists in one form or another, but making it robust and usable is a whole other matter.

As the project takes shape I hope to post updates here. If you have any suggestions feel free to make them. The current target is to have this "out the door" by the end of May.

Where is the "crowd" in crowdsourcing? Mapping EOL Flickr photos

In any discussion of data gathering or data cleaning the term "crowdsourcing" inevitably comes up. A example where this approach has been successful is the Encyclopedia of Life's Flickr pool, where Flickr users upload images that are harvested by EOL.

Given that many Flickr photos are taken with cameras that have built-in GPS (such as the iPhone, the most common camera on Flickr) we could potentially use the Flickr photos not only as a source of images of living things, but to supplement existing distributional data. For example, Flickr has enough data to fairly accurately construct outlines of countries, cities, and neighbourhoods, see The Shape of Alpha, so what about organismal distribution?

This question is part of a Masters project by Jonathan McLatchie here at Glasgow, comparing distributions of taxa in GBIF with those based on Flickr photos. As part of that project the question arose "where are the Flickr photos being taken?" If most of the photos are being taken in the developed world, then there are at least two problems. The first is the obvious bias against organisms that live elsewhere (i.e., typically many photos won't be taken in those regions where you'd actually like to get more data). Secondly, the presence of zoos, wildlife parks, and botanical gardens means you are likely to get images of organisms well outside their natural range.

Jonathan suggested a "heatmap" of the Flickr photos would help, so to create this I wrote a script to grab metadata for the photos from the Encyclopedia of Life's Flickr pool, extract latitude and longitude, and draw the resulting locations on a map. I aggregated the points into 1°×1° squares, and generated a GBIF-style map of the photos:

Screenshot

Lots of photos from North America, Europe, and Australasia, as one might expect. Coverage of the rest of the globe is somewhat patchy. I guess the key question to ask is extent the "crowd" (Flickr users in this case) is essentially replicating the sampling biases already in projects like GBIF that are aggregating data from museum collections (most of which are in the developed world).

The PHP code to fetch the photo data and create the map is available in github. You'll need a Flickr API key to run the script. The github repository has an SVG version of the map (with a bitmap background). A bitmap copy of the map is available on FigShare http://dx.doi.org/10.6084/m9.figshare.92668.

Visualising differences between classifications using cluster maps

As part of a project to build a tool to navigate through taxonomic names and classifications I've become interested in quick ways to compare classifications. For example, EOL has multiple classifications for the same taxon, and I'd like to quickly discover what the similarities and differences are.

One promising approach is to use "cluster maps", a technique described by Fluit et al. (see Aduna Cluster Map for an implementation):

Fluit, C., Sabou, M., & Harmelen, F. (2006). Visualizing the Semantic Web. (V. Geroimenko & C. Chen, Eds.) (pp. 45–58). Springer Science + Business Media. doi:10.1007/1-84628-290-X_3 (see also http://www.cs.vu.nl/~frankh/abstracts/VSW05.html)

Cluster map details

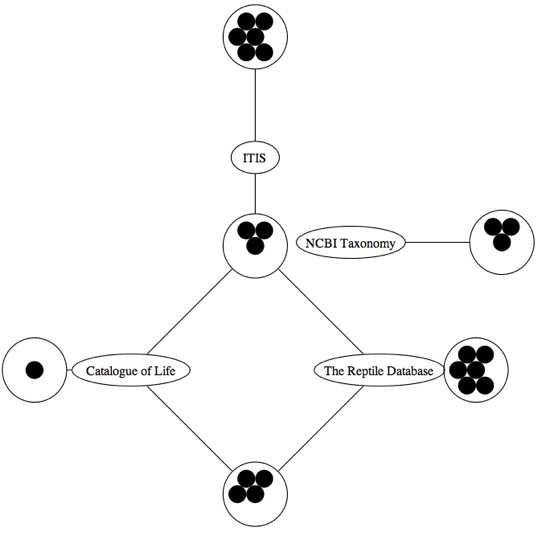
Cluster maps can be thought of as fancy Venn Diagrams, in that they can be used to depict the overlap between sets of objects. The diagram is a graph with two kinds of nodes. One represents categories (in the example above, file formats and search terms), the other represents sets of objects that occur in one or more categories (in the example above, these are files that match the search terms "rdf" and "aperture").

I've cobbled together a crude version of cluster maps. For a given taxon (e.g., a genus) I list all the immediate sub-taxa (e.g., species) in each classification in EOL, and then find the sets of sub-taxa that are shared across the classification sources (e.g., ITIS, NCBI, etc.) and those that are unique to one source. I then create the cluster map using Graphviz. Inspired by the hexagonal packing used by Aduna, I've done something similar to display the taxa in each set. Adding these to the output of Graphviz required a little fussing with. First I get Graphviz to output the graph in SVG, then I load the SVG into a program that locates each node in the graph and inserts SVG for the packed circles (given that SVG is XML this is fairly straightforward).

As an example, consider the genus Demansia (http://eol.org/pages/34967/overview). EOL reports four classifications for this genus. Below is a cluster map for this genus:

34967

This diagram show that, for example, the Catalogue of Life (CoL) and Reptile databases share 4 names, these databases share three other names with ITIS. All databases have names unique to themselves, one database (NCBI) is completely disconnected from the other three databases.

One important caveat here is that I'm mapping the scientific names as returned by EOL, and in many cases these contain the taxonomic authority. This is a major headache, prompting this outburst:


If we clean the names by removing the taxonomic authority the clusters overlap rather more:
Demansia
Now we see that only ITIS and the Reptile Database have unique names. This is one reason why I get stroppy when taxonomists start saying databases shouldn't have to supply cleaned "canonical" names. If the names have authorities then I have to clean them, because in many cases the authorities (while useful to know) are inconsistent across databases. For example:

  • Demansia olivacea GRAY 1842 versus Demansia olivacea (Gray, 1842)
  • Demansia torquata GÜNTHER 1862 versus Demansia torquata (Günther, 1862)

Taxonomic authorities are frequently misspelt, and people seem confused about when to use parentheses or not. Databases should spare the user some pain and provide clean names (and authority strings separately where they have them).

The visualisation is still incomplete (I need to make it interactive), but it shows promise. The names that are unique to one database are usually worth investigating. In some cases they are names other databases regard as synonyms, in other cases they represent spelling variations. The goal of this visualisation is to highlight the names that the user might want to investigate further.

Using a zoomable treemap to visualise a taxonomic classification

One visualisation method I keep coming back too is the treemap. Each time I experiment with them I learn a little bit more, but I usually end up abandoning them (with the exception of using quantum treemaps to display bibliographic data). But they keep calling me back.

My latest experiment builds on some earlier thoughts on quantum treemaps, but tackles two issues that have kept bugging me. The first is that quantum treemaps are limited to hierarchies that are only two levels deep (e.g., family → genus → species). This is because, unlike regular treemaps where you are slicing and dicing a rectangle of predetermined size, when you construct a quantum treemap you don't know how big it will be until you've made it (this is because you want to ensure that every item in the hierarchy can be displayed at the same size, and fitting them in may require you to tweak the size of the treemap). Given that taxonomic classifications have > 2 levels this is a problem. One approach is to construct quantum treemaps for the lower parts of the classification, then pack those into a larger rectangle. This is an instance of the packing problem. After Googling for a bit I came up across this code for packing rectangles, which was easy to follow and gave reasonable results.

The second problem is that I want the treemap to be interactive. I want to be able to zoom in and out and navigate around the treemap. After more Googling, I came across the Zoomooz.js library which makes web page elements zoom (for a pretty mind-blowing example of what can be done see impress.js), but I decided I want to work with SVG. After playing with examples from Keith Wood's jQuery SVG plugin I started to get the hang of creating zoomable visualisations in SVG.

Here's a video of what I've come up with so far (you can see this live at http://iphylo.org/~rpage/zoomrect/primates.html). This is an interactive display of the Catalogue of Life 2010 classification of primates, with images from EOL. It's crude, there are some obvious issues with redrawing images, labels, etc., but it gives a sense of what can be done. With care this could probably be scaled up to handle the entire Catalogue of Life classification. With a bit more care, it could probably be optimised for the iPad, which would be a fun way to navigate through the diversity of life.

Can you trust EOL?

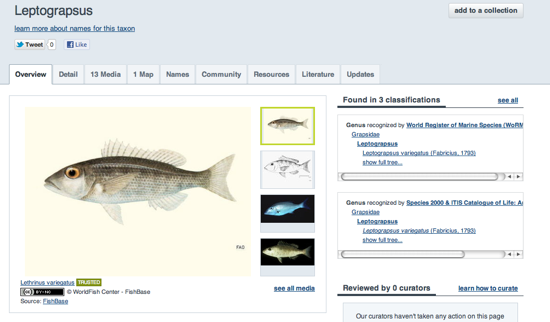
There's a recent thread on the Encyclopedia of Life concerning erroneous images for the crab Leptograpsus. This is a crab I used to chase around rooks on stormy west-coast beaches near Auckland, so I was a little surprised to see the EOL page for Leptograpsus looks like this:

Leptograpsus

The name and classification is the crab, but the image is of a fish (Lethrinus variegatus). Perhaps at some point in aggregating the images the two taxa, which share the abbreviated name "L.variegatus" got mixed up.

Now, errors like this are bound to happen in a project the size of EOL, and EOL has some pretty active efforts to clean up errors (e.g., the Homonym Hunters). But what bothers me about this example is the prominent label Trusted that appears below the image. If I look at all the images for Leptograpsus on EOL, I see "trusted" images for fish. All images of the crab (i.e., the real Leptograpsus) are labelled "unreviewed" and implicitly "untrusted":

Leptograpsus2

If you are going to claim something is "trusted" you need to be very careful. The images of the fish may well come from a trusted source (FishBase), and FishBase's assertion that the image is of Lethrinus variegatus may well be "trusted", but I certainly can't trust the assertion made by EOL that this image depicts a crab.

In this example the error is easy to spot (if you know that crabs and fish are different), but what if the error was more subtle? Or what if you are using EOL's API and explicitly asking for only content you can trust? Then you get the fish images (see https://gist.github.com/2850321).

If I can't trusted "trusted" then EOL has a problem. One way forward is to unpack the notion of "trust" and make sure the user knows what "trusted" means. In this case there are at least two assertions being made:
  1. This image is of a fish (made by FishBase)
  2. This image is of a crab (made by EOL)

EOL needs to make clear what assertions are being made, and which ones it is stating can be "trusted". Ideally it also needs to move away from blanket assertions of "trusted" versus not trusted, because that's far too coarse (just because FishBase knows about fish I'm not sure I'm going to put equal trust that every image it contains has been correctly identified). Trust is something that is conferred by users and acquired over time, not something to be simply asserted.

EOL challenge draft proposal

In the spirit of the Would you give me a grant experiment? [1] here's the draft of a proposal I'm working on for the Computable Data Challenge. It's an attempt to merge taxonomic names, the primary literature, and phylogenetics into one all-singing, all-dancing website that makes it easy to browse names, see the publications relevant to those names, and see what, if anything, we know about the phylogeny of those taxa. It builds on a number of other projects I've been working on, most recently my efforts to link names to the primary literature. Comments welcome (the proposal deadline is next week).

The proposal is embedded below using Google's PDF viewer, if you can't see it try logging into your Google account, or click here.


1. The answer from NERC was a resounding "no".

EOL Computable Data Challenge community

17823 130 130Now we are awash in challenges! EOL has announced its Computable Data Challenge:
We invite ideas for scientific research projects that use EOL, including the Biodiversity Heritage Library (BHL), to answer questions in biology. The specific field of biological interest for the challenge is open; projects in ecology, evolution, behavior, conservation biology, developmental biology, or systematics may be most appropriate. Projects advancing informatics alone may be less competitive. EOL may be used as a source of biological information, to establish a sampling strategy, to assist the retrieval of computable data by mapping identifiers across sources (e.g. to accomplish name resolution), and/or in other innovative ways. Projects involving data or text or image mining of EOL or BHL content are encouraged. Current EOL data and API shall be used; suggestions for modification of content or the API could be a deliverable of the project. We encourage the use of data not yet in EOL for analyses. In all cases projects must honor terms of use and licensing as appropriate.

Some $US 50,000 is on offer. "Challenge" is perhaps a misnomer, as EOL is offering this money not as a prize at the end, but rather to fund one or more proposals (submitted by 22 May) that are accepted. So, it's essentially a grant competition (with a pleasingly minimal amount of administrivia). There is also a Computable Data Challenge community to discuss the challenge.

It's great to see EOL trying different strategies to engage with developers. Of the different challenges EOL is running this one is perhaps the most appealing to me, because one of my biggest complaints about EOL is that it's hard to envisage "doing science" with it. For example, we can download GenBank and cluster sequences into gene families, or grab data from GBIF and model species distributions, but what could we do with EOL? This challenge will be a chance to explore the extent to which EOL can support science, which I would argue will be a key part of its long term future.

EOL Phylogenetic Tree Challenge

34106 130 130The Encyclopedia of Life have announced the EOL Phylogenetic Tree Challenge. The contest has two purposes:


It provides a testbed for the Evolutionary Informatics community to develop robust methods for producing, serving, and evaluating large, biologically meaningful trees that will be useful both to the research community and to broader audiences.

It enables the Encyclopedia of Life to organise the information it aggregates according to phylogenetic relationships; in other words, it provides a direct pipeline from research results to practical use.


First prize is a trip to iEvoBio 2012, this year in Ottawa, Canada. For more details visit the challenge website. There is also an EOL community devoted to this challenge.

Challenges are great things, especially ones with worthwhile tasks and decent prizes. EOL badly needs a phylogenetic perspective, so this is a welcome development.

But (there's always a but), I can't help feeling that we need something a little more radical. The tree of life isn't a tree. At deep levels it's a forest, and even at shallow levels things are a complicated tangle of gene trees. Sometimes the tree is clear, sometimes not, and some of this is real and some reflects our ignorance.

If you want a simple tree to navigate, then I'd argue that the NCBI tree is a pretty good start, and EOL already has this. What would be really cool is to have a way to navigate that makes it clear that phylogenetic knowledge has a degree of uncertainty, and that the "tree of life" might be better depicted as a set of overlapping trees. The mental image I have is of a collage of trees from different data sets, superimposed over each other, with perhaps an underlying consensus to help navigate. This visualisation could be zoomable, because in some ways the tree of life is fractal. Trees don't stop at species, as the wealth of barcoding and phylogeographic studies show. Given computational constraints (not to mention visualisation issues), I wonder whether there is an effective limit to the size of any one tree in terms of number of taxa. What varies is the taxonomic scope. So we could imagine a backbone tree based on slowly evolving genes, we zoom in and more trees appear, but at lower levels, and finally we hit populations and individuals, trees that may have 100's of samples, but a very narrow scope.

This is all rather poorly articulated, but I can't help wondering whether a phylogenetic classification will end up distorting the very thing we're trying to depict. It also looses connection with the underlying data (and trees), which for me is a huge drawback of existing classifications. There's no sense of why they are the way they are. There's a chance here to bring together ideas that have been kicking around in the phylogenetic community for a couple of decades and rethink how we navigate the "tree of life".

EOL iPad web app using jQueryMobile

As part of a course on "phyloinformatics" that I'm about to teach I've been making some visualisations of classifications. Here's one I've put together using jQuery Mobile and the Encyclopedia of Life API. It's pretty limited, but is a simple way to explore EOL using three different classifications. You can view this live at http://iphylo.org/~rpage/phyloinformatics/eoliphone/ (looks best on an iPad or iPhone). Once I've tidied it up I'll put the code online. Meantime here's a quick demo:

BHL needs to engage with publishers (and EOL needs to link to primary literature)

Browsing EOL I stumbled upon the recently described fish Protoanguilla palau, shown below in an image by rairaiken2011:
Palauan Primitive Cave Eel

Two things struck me, the first is that the EOL page for this fish gives absolutely no clue as to where you would to find out more about this fish (apart from an unclickable link to the Wikipedia page http://en.wikipedia.org/wiki/Protoanguilla - seriously, a link that isn't clickable?), despite the fact this fish has been recently described in an Open Access publication ("A 'living fossil eel (Anguilliformes: Protanguillidae, fam. nov.) from an undersea cave in Palau", http://dx.doi.org/10.1098/rspb.2011.1289).

Now that I've got my customary grumble about EOL out of the way, let's look at the article itself. On the first page of the PDF it states:
This article cites 29 articles, 7 of which can be accessed free
http://rspb.royalsocietypublishing.org/content/early/2011/09/16/rspb.2011.1289.full.html#ref-list-1

So 22 of the articles or books cited in this paper are, apparently, not freely available. However, looking at the list of literature cited it becomes obvious that rather more of these citations are available online than we might think. For example, there are articles that are in the Biodiversity Heritage Library (BHL), e.g.


Then there are articles that are available in other digitising projects

  • Hay O. P. 1903 On a collection of Upper Cretaceous fishes from Mount Lebanon, Syria, with descriptions of four new genera and nineteen new species. Bull. Am. Mus. Nat. Hist. N. Y. 19, 395–452. http://hdl.handle.net/2246/1500
  • Nelson G. J. 1966 Gill arches of fishes of the order Anguilliformes. Pac. Sci. 20, 391–408. http://hdl.handle.net/10125/7805

Furthermore, there are articles that aren't necessarily free, but which have been digitised and have DOIs that have been missed by the publisher, such as the Regan paper above, and


So, the Proceedings of the Royal Society has underestimated just how many citations the reader can view online. The problem, of course, is how does a publisher discover these additional citations? Some have been missed because of sloppy bibliographic data. The missing DOIs are probably because the Regan citation lacks a volume number, and the Trewavas paper uses a different volume number to that used by Wiley (who digitised Proc. Zool. Soc. Lond.). But the content in BHL and other digital archives will be missed because finding these is not part of a publisher's normal workflow. Typically citations are matched by using services ultimately provided by CrossRef, and the bulk of BHL content is not in CrossRef.

So it seems there's an opportunity here for someone to provide a service for publishers that adds value to their content in at least three ways:
  1. Add missing DOIs due to problematic citations for older literature
  2. Add links to BHL content
  3. Add links to content in additional digitisation projects, such as journal archives in DSpace respositories

For readers this would enhance their experience (more of the literature becomes accessible to them), and for BHL and the repositories it will drive more readers to those repositories (how many people reading the paper on Protoanguilla palau have even heard of BHL?). I've said most of this before, but I really think there's an opportunity here to provide services to the publishing industry, and we don't seem to be grasping it yet.

I think I now "get" the Encylopedia of Life

The Encylopedia of Life (EOL) has been relaunched, with a new look and much social media funkiness. I've been something of an EOL sceptic, but looking at the new site I think I can see what EOL is for. Ironically, it's not really about E. O. Wilson's original vision (doi:10.1016/S0169-5347(02)00040-X:
Imagine an electronic page for each species of organism on Earth, available everywhere by single access on command. The page contains the scientific name of the species, a pictorial or genomic presentation of the primary type specimen on which its name is based, and a summary of its diagnostic traits. The page opens out directly or by linking to other data bases, such as ARKive, Ecoport, GenBank and MORPHOBANK. It comprises a summary of everything known about the species’ genome, proteome, geographical distribution, phylogenetic position, habitat, ecological relationships and, not least, its practical importance for humanity.
We still lack a decent database that does this. EOL tries, but in my opinion still falls short, partly because it isn't nearly aggressive enough in harvesting and linking data (links to the primary literature anyone?), and has absolutely no notion of phylogenetics.

In terms of doing science I don't see much that I'd want to do with EOL, as opposed, say, to Wikipedia or existing taxonomic databases. But thinking about other applications, EOL has a lot of potential. One nice feature is the ability to make "collections". For example, Cyndy Parr has created a collection called Fascinating textures, which is simply a collection of images in EOL (I've included some below):

Textures
What is nice about this is that it cuts across any existing classification and assembles a set of taxa that share nothing other than having "fascinating textures". This ability to tag taxa means we could create all sorts of interest sets of taxa based on criteria that are meaningful in a particular context. For example, egotist that I am, I created a collection called Taxa described by Roderic Page, which includes the one crab and 6 bopyrid isopods that I described in the 80's.

Putting on my teaching hat, I'm involved in teaching a course on animal diversity and could imagine assembling collections of taxa relevant to a particular lecture (either taxonomically, or based on some other criteria, such as all parasites of a particular taxon, or all organisms found associated with deep sea vents. Other collections could be built by people or organisations with content. For example, lists of top ten new species, lists of species for which the BBC has content, etc.

In this sense, EOL becomes a tagging service for life, a bit like delicious. The social network side of things is still a little clunky —there doesn't seem to be a notion of "contacts" or "friends", and it needs integration with existing social networks — but I think I now "get" what EOL is for.

Navigating the Encyclopedia of Life tree on the desktop and the iPhone

This week seems to be API week. The Encyclopedia of Life API Beta Test has been out since August 12th. By comparison with the Mendeley API that I've spent rather too much time trying to get to grips with, the EOL API release seems rather understated.

However, I've spent the last couple of days playing with it in order to build a simple tree navigating widget, which you can view at http://iphylo.org/~rpage/eoltree/.

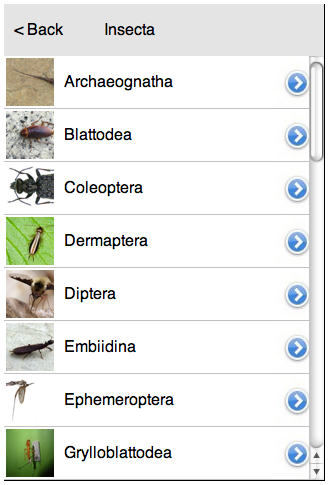
The widget resembles Aaron Thompson's Taxonomy (formerly called KPCOFGS) iPhone app in that it uses the iPhone table view to list all the taxa at a given level in a taxonomic tree. Clicking on a row in this table takes you to the descendants of the corresponding taxon, clicking "Back" takes you back up the tree. if you've reached a leave node (typically a species) the widget displays a snippet of information about that taxon. It also resembles Javier de la Torre's taxonomic browser written in Flex.

Here's a screen shot of the widget running in a desktop web browser:

insecta.png

Here's the same widget in the iPhone web browser:

web.pngUsing the API
The EOL API is pretty straightforward. I call the http://www.eol.org/api/docs/hierarchy_entries API to get the tree rooted at a given node, then populate each child of that node using http://www.eol.org/api/docs/pages. The result is a simple JSON file that I cache locally to speed up performance and avoid hitting the EOL servers for the same information. because I'm locally caching the API calls I need a couple of PHP scripts to do this, but everything else is HTML and Javascript.

iPhone and iPad
I've not really developed this for the iPhone. I've cobbled together some crude Javascript to simulate some iPhone-like effects, but if I was serious about the phone I'd look into one of the Javascript kits available for iPhone development. However, I did want something that was similar in size to the iPhone screen. The reason is I'm looking at adding taxonomic browsing to the geographic browser I described in the post Browsing a digital library using a map, so I wanted something easy to use but which didn't take up too much space. In the same way that the Pygmybrowse tree viewer I played with in 2006 was a solution to viewing a tree on a small screen, I think developing for the iPhone forces you to strip things down to the bare essentials.

I'm also keeping the iPad in mind. In portrait mode some apps display lists in a popover like this:

popover_flatten.png

This popover takes up a similar amount of screen space to the entire iPhone screen, so if I was to have a web app (or native app) that had taxonomic navigation, I'd want it to be about the size of the iPhone.

Let me know what you think. Meantime I need to think about bolting this onto the map browser, and providing a combined taxonomic and geographic perspective on a set of documents,

BHL Tech Report

Chris Freeland tweeted about the presentation he gave to a recent BHL meeting, the slides for which are reproduced below:


It makes interesting viewing. From my own (highly biased) perspective slide 10 is especially interesting, in that BioStor, my tool for locating articles in BHL is the 8th largest source of traffic for BHL - 2.46% of visitors to BHL come via BioStor. By way of comparison, the largest single referrer for the same period is Tropics (11.14%), with EOL third at 6.45% and Wikipedia fourth at 5.56%. Obviously this is a small sample, but it is vaguely encouraging. It is nice to see Wikipedia being a significant source of links. EOL has dropped significantly from being the largest referrer (22.51%) in 2008-2009 to third (6.45%) for 2010 to date. In one sense this may reflect BHL achieving greater visibility independently of EOL. I also wonder whether it might reflect the unsatisfactory way EOL displays BHL results? If the BHL results were grouped (for example, by article), then I suspect they may provide more enticing links for EOL users to click on (especially, for example, if the articles were flagged by whether they included the original description of a taxon). It would be fun to know what EOL users actually do (e.g., what fraction of EOL visitors to a given page click on BHL links?).

Visualising the Biodiversity Heritage Library as a Timeline

bhlstrip.pngOne thing about the Encyclopedia of Life which bugs me no end is the awful way it displays the bibliography generated from the Biodiversity Heritage Library (BHL). The image on the right shows the bibliography for the frog Hyla rivularis Taylor, 1952. It's one long, alphabetical list of pages. How can a user make sense of this? It's even more annoying because the BHL is one of the cornerstones of EOL, and one could argue that BHL content is one of the few thing pages EOL offer that distinguishes them from cheap and cheerful mashups such as iSpecies. Can't we do something a little better?

BHL has an API (documented here), so I decided to experiment. As I mentioned in an earlier post (Biodiversity Heritage Library, Google books, and metadata quality), a key piece of metadata about a bibliographic reference is its date. This is especially so for the taxonomic literature, where the earliest reference that contains a name may (depending on how complete BHL scanning is) be the first description of that name. So, it would be nice to order the BHL bibliography by date. Turns out it's possible to get dates from quite a few BHL items, providing one fusses with regular expressions long enough.

So, in principle we could sort BHL content by dates. But, we could go one better and visualise them. As an experiment, I've put together a demo that uses the SIMILE Timeline widget to display the BHL bibliography for a taxon. Here's a screenshot of the bibliography for Hyla rivularis:
bhltimeline.png


You can generate others at http://bioguid.info/bhl/. The demo has been thrown together in haste, but here's what it does:
  1. Takes a taxon name and tries to find it in uBio. This gives us the NamebankID BHL needs
  2. Calls the BHL API and retrieves the bibliography for the NamebankID found in step 1
  3. Parses the BHL result, trying to extract dates (often the dates are ranges, e.g. 1950-1955)
  4. The previous step generates a JSON document which can be displayed by Timeline

If you click on an item you get a list of pages, clicking on any those takes to you to the page in BHL. Items that have a range of dates are displayed as horizontal lines, items with a well-defined date are shown as points. Note that my code for working out the date of an item will probably fail on some items, and some items don't have any dates at all. Hence, not every item in BHL will appear in the timeline.

It would be nice to embellish the results a little (for example, group pages into articles, refine the dates, etc.) but I think this goes a little way to demonstrating what can be done. We could also add articles obtained from other sources (e.g., Google Scholar, PubMed) to the same display, providing an overview of published knowledge about a taxon.

Google, Wikipedia, and EOL

One assumption I've been making so far is that when people search for information on an organism using its scientific name, Wikipedia will dominate the search results (see my earlier post for an example of this assumption). I've decided to quantify this by doing a little experiment. I grabbed the Mammal Species of the World taxonomy and extracted the 5416 species names. I then used Google's AJAX search API to look up each name in Google. For each search I took the top 10 hits and recorded for each hit the site URL and the rank in the search results (i.e., 1-10). Below is a table of how many mammal species had a hit in the top 10 Google results (showing just the top 20 most frequent sites).
SiteHits
en.wikipedia.org5266
species.wikimedia.org2934
animaldiversity.ummz.umich.edu2890
commons.wikimedia.org1515
www.itis.gov1418
ctd.mdibl.org1288
www.bioone.org1101
www.uniprot.org1086
encyclopedia.farlex.com1007
www.thewebsiteofeverything.com955
www.answers.com864
vertebrates.si.edu854
www.interaktv.com842
www.arkive.org775
linkinghub.elsevier.com727
www.springerlink.com656
www.eol.org618
www.reference.com576
doi.wiley.com572
noctilio.com566


Wikipedia is the clear winner, with 5266 (97%) of mammals having a Wikipedia page in the top ten Google results. Next comes Wikispecies, then Animal Diversity Web, Wikimedia Commons, ITIS, the Comparative Toxicogenomics Database, BioOne, UniProt (derived from the NCBI taxonomy), and so on. Note that the Encyclopedia of Life comes in 17th.

Things get more interesting if we look at the ranking of search results. The graph below plots the cumulative rank of search results for some of the web sites listed above.
ranks.png

Wikipedia dominates things. For 48% of all mammal species Wikipedia is the first result returned by Google. Just under three quarters of all mammal species are either the first or second top hit in Google. The next best sites are Animal Diversity Web and Wikispecies, which get a small share of first place for some species (19% and 7% respectively). Note that EOL pages manage to make it into the top 10 for only 11% of all mammal species.

What does this all mean? Well, it seems clear that if people are using Google to find information about an organism, then Wikipedia is more likely than anything else to be the first result they see. It is also interesting that for all the energy (and funds) being expended on biodiversity databases (doi:10.1126/science.324_1632), ITIS is the only classical biodiversity database that routinely gets found in these searches (albeit in only a quarter of the searches).

I know I tend to go on a bit about EOL, but if I was running (or funding) EOL, I'd be worried. EOL barely figures in these search results, and is being taken to the cleaners by a volunteer effort (Wikipedia). Furthermore, it seems difficult to envisage what EOL can do to improve things. Sure it can link to (and make use of) content in sites such as Animal Diversity Web, ITIS (and maybe even, gasp, Wikipedia), but that just adds "link love" to those sites. Ironically, perhaps the single thing that would improve EOL's ranking would be if Wikipedia spread some of its link love over EOL, by linking all it's taxon pages to the corresponding EOL page.

But there are bigger issues at stake. Site popularity on the web tends to follow a power law, where a very few web sites grab the vast majority of eye balls. In a old blog post Clay Shirky wrote:

Now, thanks to a series of breakthroughs in network theory by researchers ... we know that power law distributions tend to arise in social systems where many people express their preferences among many options. We also know that as the number of options rise, the curve becomes more extreme. This is a counter-intuitive finding - most of us would expect a rising number of choices to flatten the curve, but in fact, increasing the size of the system increases the gap between the #1 spot and the median spot.


So, creating new and improved biodiversity web sites is likely to have the effect of only increasing the gap between Wikipedia and the rest.

Lastly, as I've mentioned before regarding Wikipedia and citations of taxonomic work, the graph above suggests to me that for anybody wanting to make basic biodiversity information available on the web, and attract readers to basic taxonomic literature, there really is only one game in town.

EOL, Wikipedia, TDWG, LinkedData, and the Vision Thing

Time for more half-baked ideas. There's been a lot of discussion on Twitter about EOL, Linked Data (sometimes abbreviated LOD), and Wikipedia. Pete DeVries (@pjd) is keen on LOD, and has been asking why TDWG isn't playing in this space. I've been muttering dark thoughts about EOL, and singing the praises of Wikipedia. On so it goes on. So, here's one vision of where we could (?should) be going with this.

Let's imagine that we do indeed want to play in the Linked Data space. The concern that tends to raised the most is that biodiversity informatics uses LSIDs as the standard GUID, and this doesn't play nice with Linked Data. This is true, but not life threatening. There are various hacks (like this and this that deal with this).

But, the real concern (I think) is that we need a way to link our stuff to the rest of the Linked Data cloud. That is, wherever possible we need to reuse existing identifiers. In the LOD diagram below (for the latest version see here) DBpedia.org is key to linking much of this together, and major players (such as the BBC) are now using DBpedia.org to make connections.


DBpedia.org is based on Wikipedia, so I think you can see where this is going. There are some 120,000+ taxon pages in Wikipedia, so that's some 120,000+ identifiers in DBpedia.org that others interested in organisms can (and will) use to refer to taxa. Given the centrality of Wikipedia and DBpedia to LOD, why don't we adopt DBpedia.org URIs as the default GUID for our taxa? At present we have numerous, competing identifiers (e.g., NCBI tax ids, ITIS tsn's, Catalogue of Life LSIDs, uBio NameBankID's, plus LSIDs from various nomenclators). For users this is a mess -- which one do I use? Deciding requires dealing with issues (such as the difference between nomenclatural codes, and between taxonomic names and concepts, etc., that frankly, nobody outside our community cares about.

So, if we want to play with LOD, we need to make our identifiers play nice (straightforward), and we should think seriously about adopting DBpedia.org URIs as the default GUID for taxa.

Now, where does this leave EOL? Well, frankly, it should get out of the business of making web pages for taxa, because Wikipedia owns that space already. Their pages are fewer, but often much more detailed than the corresponding EOL page, and Wikipedia reacts faster to new discoveries. Wikipedia supports community editing, versioning, and quite sophisticated tools for handling biblographic references.

There's plenty of scope for userful tools and services for EOL to develop, but I think the real game is elsewhere. Now, Wikipedia is far from perfect. It's basically semi-structured text with a God-awful template language, and it would benefit greatly from more structure (e.g., as could be provided by Semantic Mediawiki), but I think we should think about building upon it. We could build our own (and my experiments over at itaxon.org explore this), but the big challenge is getting a community around a project, and if David Shorthouse's pronouncement that The Community is Dead is correct, then maybe we should get on board with the community that already exists. Perhaps what EOL should be doing is talking to Wikipedia, improving the existing templates for taxon pages, and creating bots to automatically populate Wikipedia with more taxon pages.

Visualizing the Evolutionary Tree of Life

Over on the EOL blog is a summary of a meeting Visualizing the Evolutionary Tree of Life. This sounds like it was a fun meeting, but part of me is suffering from déjà vu. Our community has tossed this subject around for a while now. I recall Tamara Munzner wowing us with the H3 hyperbolic browser at a meeting at UC Davis in 2000 (part of the original NSF TOL workshops, archived herel) -- the image of Joel Cracraft excitedly running up to the display screen to find various birds is forever etched into my brain. TreeJuxtaposer has been around for a while, to not much effect.

We seem to continue to fail to make much progress on this topic, despite meetings such as the EOL one, great reviews of the topic, fancy 3D visualisation, and Mike Sanderson's way kewl wall of monitors.

Maybe progress was made at the EOL meeting, but I don't get the sense that we're any further forward. It would be interesting to work out why we've struggled to satisfactorily solve this problem.

bioGUID manuscript

Finally submitted (two days late) a manuscript for the BMC Bioinformatics Special Issue on Biodiversity Informatics organised by Neil Sarkar and sponsored by EOL and CBOL. The manuscript, entitled "bioGUID: resolving, discovering, and minting identifiers for biodiversity informatics" describes my bioGUID project. If you are interested made pre-print available at Nature Precedings (hdl:10101/npre.2009.3079.1).

LSIDs, disaster or opportunity

OK, really must stop avoiding what I'm supposed to be doing (writing a paper, already missed the deadline), but continuing the theme of LSIDs and short URLs, it occurs to me that LSIDs can be seen as a disaster (don't work in webrowsers, nobody else uses them, hard to implement, etc.) or an opportunity. The URL shortening service bit.ly provides information on each shortened URL (e.g., http://bit.ly/3R6apo, such as a summary of the URL


statistics on how the URL is being accessed


conversations (who is talking about this URL)


and lastly metadata harvested from the URL using services such as Open Calais


Imagine we provided the same services for LSIDs. In other words, instead of a simple HTTP proxy such as http://bioguid.info, the proxy stores information on how often the LSID is resolved (and by whom), where the LSID has been cited (web pages, papers, etc), and what metadata is has (the last bit is easy, we don't need a tool like Open Calais). We could extend this to other identifiers, such as DOIs (for which we could do things like show whether the DOI has been bookmarked by Connotea, CiteULike, etc.).

Now, if one of our large projects (e.g., GBIF or EOL) showed a little bit of ambition and creativity and did something like this, we could have a cool tool. Plus, we'd be aggregating metadata along the way. I think this could lead to the first "killer app" for biodiversity informatics.